Sensorhub - platform for IoT data

Sensorhub - is a Proof of Concept project to build scaleable platform for storing sensor readings in efficient way. It collects, process and shows data. It's built on top of open-source solutions: Ruby on Rails, Postgresql, Redis, Clickhouse, VerneMQ.

Infrastructure overview
There are 4 main parts of sensorhub:
- ESP8266-based sensor device
- MQTT queue processor
- Metadata and readings storage
- Web interface
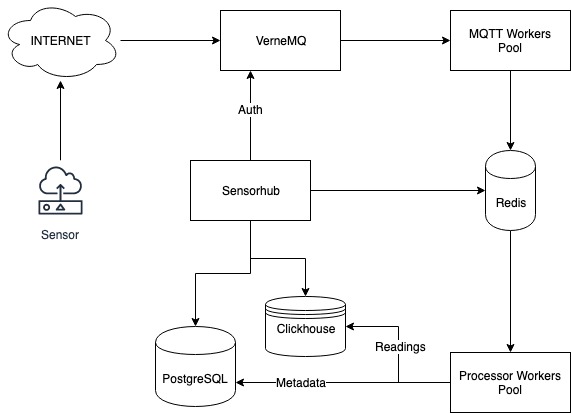
Devices connects to MQTT broker, broker asks metadata server for authentication, and device starts to send data. Data is received by pool of workers and processed in async way. Metadata is time on last contact and health of the device. Readings are inserted in time-series based storage. Web interface shows daily, weekly and monthly graphs.
ESP8266-based sensor device
We used simple Arduino SDK to make working firmware as fast as possible. We use auth based on device id and certificates for secure connection to MQTT server. Sensor is based on Bosch BME280, it provides temperature, humidity and pressure readings.
Devices is powered by USB from the computer and made with breadboard.
MQTT queue processor
We use simple script, that connects to MQTT broker, receives messages and puts to the processing queue. It's possible to run multiple processes in a sharding way. Jobs are stored in Redis for processing. Pool of workers reads data from Redis and checks if data is valid and came from known device. If everything is ok, data is accepted and saved.
Metadata and readings storage
Main application is built on top of Ruby on Rails framework with Sidekiq processing. We store metadata about devices in relational database and use it for alerts and devices authentication. When devices starts to connect to the broker, it will ask our service if devices is allowed to connect. Unauthenticated devices are rejected by the broker.
Readings are stored in time-series database built on top of Yandex Clickhouse - it's one of the best open source databases and it's perfect for readings storage.
Web interface
Web interface is a place to see data for each sensor. It shows daily, weekly and monthly readings graphs for each device.
